Across the ecommerce industry optimizing site speed is a top priority in 2019, if not the top priority for most retailers. With the continued shift to mobile browsing, site speed is critical.
- Faster sites deliver a better user experience leading to higher conversion rates and increased sales.
- There’s also an added benefit to SEO. In July 2018, Google updated its search algorithm to give greater preference to sites with fast mobile experiences, meaning slower sites were penalized and faster sites received higher organic rankings and increased (free!) traffic from Google.
 Most tech teams are regularly monitoring Lighthouse scores (Google’s measure of site speed) via tools such as the Chrome plug-in or Google Page Speed Insights.
For months, I thought the Google PageSpeed score was a black box, similar to Google’s search algorithm. Then I stumbled upon the 5 critical metrics, values, and weighting behind the PageSpeed algorithm. And this was a gamechanger for my team, allowing us to triple our mobile PageSpeed score in a month after more than 6 months of effort yielding little impact.
Have you seen the Google Lighthouse scoring calculator?

How is Google PageSpeed calculated?
- The Lighthouse score calculator is provided by Google on the PageSpeed Insights scoring details page. This official calculator tells you everything you need to know about how the PageSpeed algorithm works
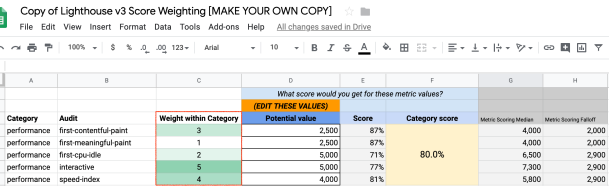
- The 2nd tab is the calculator. If you expand the columns (make a copy first), it will expose the 5 input metrics and how they are weighted to calculate a website’s PageSpeed score (pictured above)
- Time to Interactive (TTI) – is weighted highest and most important at 5, it measures how long it takes a page to become interactive for a user
- Speed index – a page load performance metric that shows you how quickly the contents of a page are visibly populated
- First contentful paint – measures the time from navigation to the time when the browser renders the first bit of content from the DOM.
- First CPU idle – measures when a page is minimally interactive, meaning a user can start interacting with most features
- First meaningful paint – is the least important of the 5 metrics, it measures when the primary content of the page is visible to a user
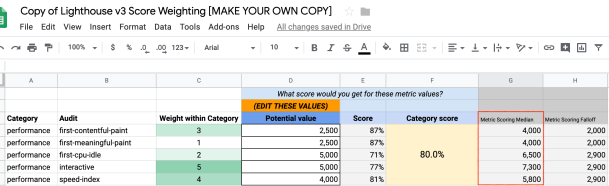
- The Lighthouse Score Calculator also shows the median scores (50th percentile) across the industry, which allows you to define goals by metric
How do we use it?
- We use it to prioritize where we should focus our dev efforts to get the greatest score improvement
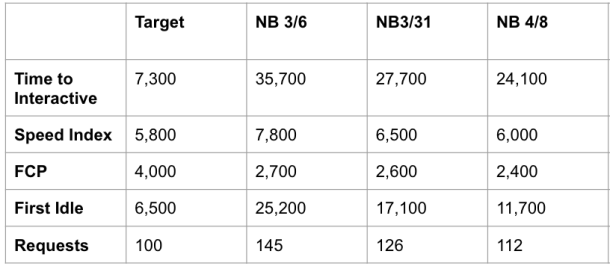
- We have added all of our competitors in here to track how they are performing by metric
Why does this matter?
- Faster site speed = better SEO rankings on Google
- Faster site speed = increased conversion rate
